•
AI
•
IT Services
•
Professional Services
October 13, 2026
AI cash-flow forecasting: how business owners can test assumptions

Can your business afford two desperately needed hires next month? Yes, according to the forecast, and your AI software took 12 seconds to work all that out. AI forecasting tools get you answers like this faster than ever. But can you trust that answer? What would have to go wrong for that yes to be a potentially costly mistake?
If that question feels hard to answer, that's because it is. Even dedicated treasury teams at large companies struggle with it. In the 2026 AFP Treasury Benchmarking Survey, 49% of treasury practitioners named cash and liquidity forecasting their most challenging task, and 63% put it among their top five priorities, more than anything else. AI and automation made treasury teams' top five, too. Even as AI gets faster, the hard part is still knowing what the forecast assumes, and whether you can act on it.
Whether you own the business or run its finances, here's what this article covers: the five assumptions behind every forecast and how to put a range on each. It also walks through a hypothetical hiring decision and gives you an editable worksheet to test your own cash flow forecast.
What is AI cash flow forecasting?
AI cash flow forecasting learns from your transaction history (e.g., when clients pay and when bills go out) to project how much cash you'll have in the weeks ahead, often over a 13-week window (one quarter). Traditional methods rely on static spreadsheets and data typed in by hand, which invites manual errors. AI forecasts update automatically as new data arrives and rerun scenarios in seconds. But AI output is only as sound as the assumptions it uses to build its projections.
AI forecasting usually sits inside a broader AI system, such as an AI finance assistant that answers questions about your financial data, or an AI CFO that covers more of the finance function.
What AI can see in your data sources
AI models use machine learning to find patterns in historical data, such as:
- How each client pays
- When vendor payments leave
- When payroll and other fixed costs hit your bank account
- How long project work takes to go from sign-off to invoice to payment
- Which payments fail or bounce, and how often
- Seasonal cash flow trends, such as slower months for billing or payment
Predictive cash flow forecasting tools pull these patterns from connected data sources, like your accounting system and bank transactions, then refresh automatically as real-time data arrives. Some can also analyze unstructured data, like notes on an invoice or the terms of a contract, alongside the structured numbers. With predictive analytics, "what-if" scenario modeling that used to take an afternoon of poring over spreadsheets now takes seconds and no technical expertise.
What AI can't see
Anything outside the data they're connected to is invisible to AI models. That could include:
- A renewal conversation with a client, over a call or email
- A client who hasn't signed off on finished project work yet
- A supplier's recent delivery problem
AI models also inherit your history, which is fine when business is going more or less as usual. One bad quarter, though, can throw the entire forecasting model's idea of "normal" off.
Why "how accurate is it?" is the wrong cash forecasting question
Vendor pages love to advertise forecast accuracy percentages and big cuts in forecasting errors compared with traditional methods. Those figures describe how close a machine learning model came, on average, to what happened in the past. But a decision like hiring rests on something narrower: whether you'll have enough cash in the tightest week of the next few months. So instead of asking how accurate forecasting is, ask:
- Which assumption, if it turned out wrong, would change your decision?
- How far would that assumption have to move before it did?
To answer those questions, you need two numbers. The rest of this guide uses both:
- The low point is the lowest balance inside your forecast window.
- The cash floor is the lowest balance you'll accept.
Just because a forecast is close "on average" doesn't mean it won't miss the week that breaks your entire plan. Gartner analyst Marco Steecker says finance now needs to "prove that AI can change how finance supports better business decisions." For finance leaders, that means a decision they can defend to a bank or a board, with the risks and assumptions clearly tracked.
The 5 assumptions behind every cash flow forecast
Every cash flow forecast rests on five assumptions about when money comes in and goes out, whether you forecast cash flow by hand or with AI. Software can only work with the assumptions you give it. If one is off by a week or a few thousand dollars, the forecast still looks precise, but the decision built on it may not hold.
Each one below covers what it usually looks like, how it can go wrong, and what to check it against in your own records.
1. When clients pay (accounts receivable)
This is the timing of cash inflows from recurring clients on managed services agreements or retainers. Every extra day clients take to pay holds back about one day of billing. For a business billing $180,000 a month, that's $6,000 a day, so clients paying a week slower holds back $42,000.
Days sales outstanding (DSO) is the usual shorthand. Test it against your own accounts receivable history, month by month, rather than an industry average. Count each inflow on the day money reaches the bank, since charging an invoice only submits the payment for processing.
2. Whether recurring revenue holds
Client behavior at renewal rarely shows up in the data until it happens, so test this one in the renewal conversation itself. Know which contracts reach their renewal date inside your forecast window, and between renewals, keep a close eye on any changes to monthly recurring revenue (MRR) by client.
Don't include any one-time projects or equipment sales in your MRR. They follow different timing, so they have their own assumptions below.
3. When project work turns into cash inflows
For agencies and consultancies, every milestone hides two assumptions: the sign-off date and the gap between the sign-off and invoice date. Check both against your last few projects, so your forecast shows when that cash will actually arrive. A sign-off that slips two weeks pushes the payment back two weeks too.
4. When you pay before you get paid
A reseller often pays their supplier before their client pays them, so the delivery date is the assumption to test. Compare recent delivery dates with promised ones. For the working-capital math, see our guide to mastering cash conversion cycles.
For example, if a supply chain disruption delays a delivery by 5 weeks, your client's payment moves back 5 weeks too. Your payment to the supplier has already gone out, so that cash is tied up until the client pays.
5. What goes out, and when (cash outflows)
Payroll, rent, insurance, software subscriptions, and estimated taxes have known dates and amounts, so they rarely need ranges (overtime or contractor cover is the usual exception). Add each one to the week those dollars actually leave your account.
Payroll is usually the biggest outflow and follows a fixed schedule. One-off payments, such as capital expenditures on new equipment or an annual software renewal, also get a date and an amount. On the other hand, variable costs, such as contractor hours, materials, and travel, move with the work. Give them a range in dollars, taken from your own actuals over the last year, with room for unexpected expenses.
How to put a range on each assumption
A range shows how far each assumption could realistically move. That tells you whether your decision will survive a bad month. Take each range from your own history, state it in the assumption's own unit, and make it wide enough that landing outside it would surprise you.
The best and worst month of the last year capture your normal cash flow fluctuations, so they make a good starting range. For a new client, or anything the data can't see, the range is a judgment call, so make sure it's labeled as such.
If you add up every low end, you get a stress test. Run it once so you know your absolute worst-case scenario. However, this worst case is a misleading final forecast because your assumptions rarely all go wrong at once, and planning for that would make almost every decision look unaffordable. Instead of changing multiple variables at once, test single assumptions, then the pairs that typically move together. For example, a weak quarter can slow payments and delay sign-offs at the same time, for the same reasons.
Ranges matter most when conditions are hard to predict. And right now they are. In August 2026, the National Federation of Independent Business (NFIB) Uncertainty Index stood at 89, well above its historical average of 68. The Justworks and U.S. Chamber of Commerce's Q3 2026 Small Business Index found that 54% of small businesses named inflation their top challenge, while 16% cited supply chain issues. In a forecast, inflation and supply chain disruptions show up as rising costs and slipping deliveries. The same U.S. Chamber survey found that most owners (72%) say they're comfortable with their cash flow today. A well-set range shows whether that comfort holds through next quarter's low point.
How finance teams test the assumptions before and after a decision
Testing is part of the forecasting process, and it happens twice: once before you commit, to check that your ranges are realistic, and again after, to catch an assumption that starts to drift.
Before you decide, run these checks:
- Backtest your ranges. Run last quarter's assumptions against what actually happened. If the actuals landed outside your ranges, widen them.
- Find your weakest assumption. That's the one with the least room to move before it pushes you below your cash floor.
- Set an action threshold for it. Write down the specific reading that will make you change the plan. You'll see one in the example below.
After you decide, keep watch. Check your weakest assumption every week and the rest every month. A simple variance analysis does the job: compare what you assumed with what actually came in and went out. If actuals keep landing outside a range, either the range is too narrow, or the assumption has changed, so update it before your next decision depends on it.
Where AI and Alti fit in your financial forecasting
For finance teams, AI is well suited to the repetitive parts of the forecasting process. It can consolidate and reconcile data from multiple systems, sort transactions into cash flow categories, match payments to invoices, and flag spending anomalies. It can also pull last quarter's actuals, run a variance analysis against what you assumed, and repeat the check every week without anyone having to remember. When a number drifts outside its range, it tells you. That leaves your time for the decision itself.
Alti is the financial intelligence inside Alternative Payments, an AI-powered financial operations platform for service businesses. It connects to your existing financial systems, including PSA tools, ERP platforms, accounting software, and business management systems. Ask Alti a question the way you'd ask a teammate, and the answer comes from your live account data. Approve what Alti proposes, and it's done in the same conversation. Human oversight is built in: nothing changes without your confirmation, and each confirmed action is logged with who approved it.
Alti is a helper, not a replacement for your judgment. While it doesn't build your cash forecast, it helps you monitor and test assumptions, no matter which tool holds the forecast. For the assumptions above, here's what that looks like using Alti:
| Cash flow forecasting assumption | How Alti helps* |
|---|---|
| When clients pay (accounts receivable) |
|
| Whether recurring revenue holds |
|
| When project work turns into cash |
|
| What goes out, and when |
|
*Feature availability depends on your plan, access level, and connected tools.
Lower your financial risk: 5 questions to ask any AI forecasting tool
Ask these five questions before you act on any AI forecasting tool's numbers.
- Can it show every assumption behind the number? J.P. Morgan advises making sure AI forecast results "can be clearly explained and easily interpreted." If a tool can't tell you what its forecasting model assumed, you can't test it.
- Does it show your lowest balance, or only where you'll end up? A forecast can end the quarter comfortably and still dip below your cash floor during a tight week. You need to see that week, and how far each assumption could move it.
- How did its last forecast compare with what happened? Its forecast accuracy on your own data beats any published average.
- Can you change one assumption and see how your lowest balance moves? That's scenario planning at its simplest: changing one assumption at a time shows which one your decision really depends on. Try it with the example below.
- Will it flag drift, and who approves what it does about it? A good tool tells you when an assumption starts moving outside its range, and it doesn't act without a person signing off. For more on how approval works when AI takes action, see our guide to AI agents in finance.
A tool that can answer all five gives you a forecast you can really test. The example below shows what that testing looks like for one hiring decision.
Cash flow forecasting example: testing a hiring decision with a 13-week cash flow forecast
Here's a hypothetical example over a 13-week window that puts everything above into practice. The decision: do you add two new hires, with $9,000 for the pair added to each payroll run from week 6?
The financial data
The business has an opening cash balance of $320,000 and bills recurring clients $180,000 a month, or about $42,000 a week, plus project milestones and occasional equipment resales.
Payroll is $60,000 every two weeks, fixed costs are $40,000 a month, and variable costs run about $15,000 a month. Two large payments are already scheduled to go out: $56,000 to a supplier in week 4 for an equipment resale, and $40,000 in estimated taxes in week 7. Two are expected to come in: the client's $70,000 for that resale in week 9, and a $60,000 project milestone in week 10.
The cash floor
This example assumes a cash floor of $160,000, which keeps cash reserves at two of today's payroll runs ($60,000 each) plus a month of fixed costs ($40,000). For simplicity, that cash floor doesn't change during the 13 weeks.
The low point
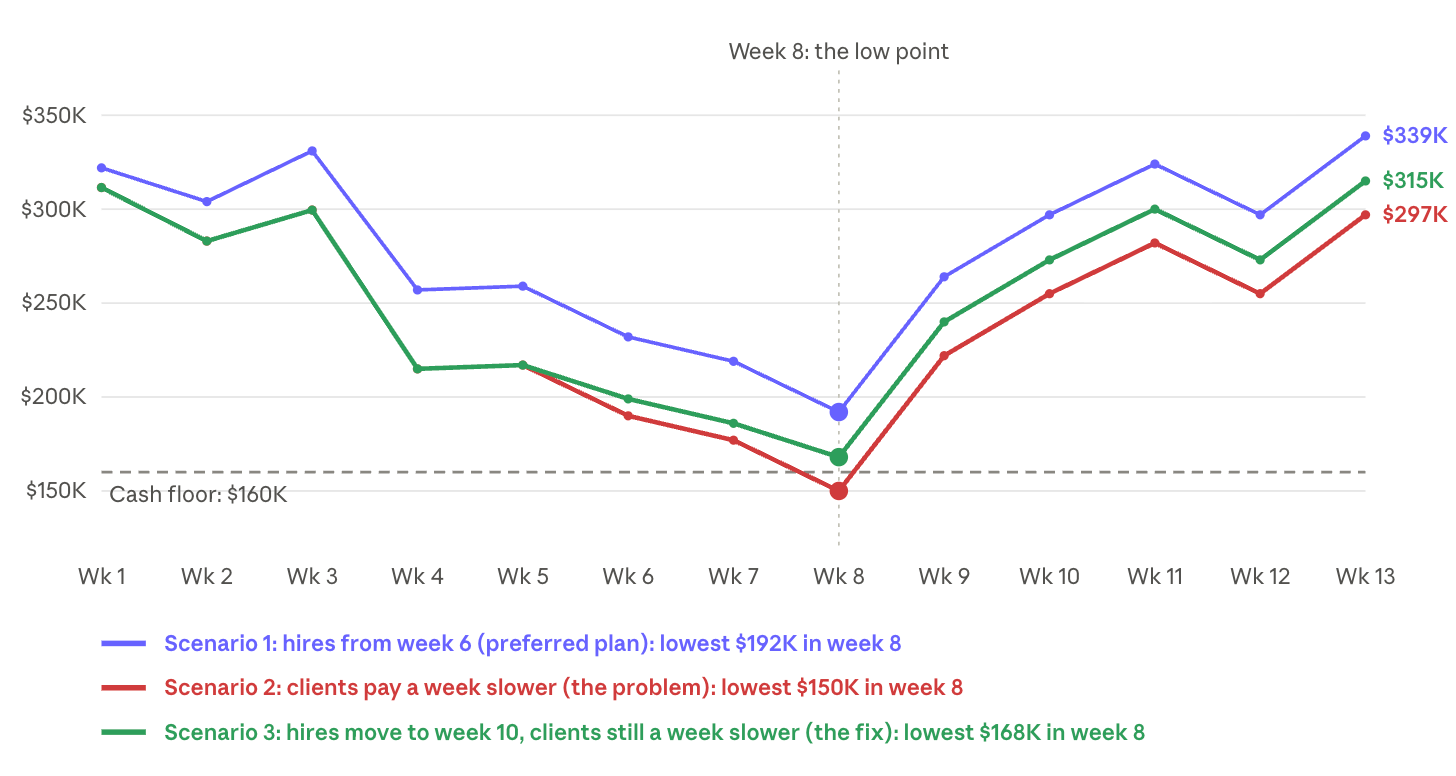
With the hires starting in week 6, the lowest cash balance of $192,000 is reached in week 8. That's after the week 4 supplier payment, the week 7 tax payment, and the week 8 payroll, but before the product and project payments in weeks 9 and 10. That leaves $32,000 of headroom above the cash floor. At $6,000 of billing a day (from assumption 1), that's about 5 days. If clients pay 6 days slower than usual, the floor breaks.
The assumptions
The table below uses the same five assumptions shown earlier, with the last assumption, "what goes out, and when," split into three rows: payroll, variable costs, and fixed costs and taxes. Each row shows the range (the high end is good for cash, the low end is bad), how much cash it could swing, and whether that swing lands before the week 8 low point.
| Assumption | Base case | Range: high vs. low end | Cash swing vs. base | Arrives before the week 8 low? | Test it against |
|---|---|---|---|---|---|
| 1. When clients pay | Clients pay in about 25 days | High: 22 days Low: 32 days | +$18K / -$42K | Yes | Average days to pay, month by month, and who has slipped |
| 2. Whether recurring revenue holds | $12K/month client renews in week 5 | High: renews with $3K a month, more scope Low: leaves at renewal | +$6K / -$24K | No (weeks 9 and 13) | The renewal conversation |
| 3. When project work turns into cash | $60K milestone signed off in week 6, paid in 30 days | High: a second $60K milestone paid by week 13 Low: sign-off slips 4 weeks | +$60K / -$60K | No (week 10) | Your last five milestone sign-offs and invoice timing after sign-off |
| 4. When you pay before you get paid | Pay supplier $56K in week 4, but client pays $70K in week 9 | High: no upside Low: delivery slips 5 weeks | $0 / -$70K | No (week 9) | Supplier's recent delivery dates vs. promised dates |
| 5. What goes out, and when | Payroll: $60K every two weeks, plus $9K a run for the hires | High: no upside Low: $15K of contractor cover in week 8 | $0 / -$15K | Yes (week 8) | Overtime and contractor history |
| Variable costs: $15K a month | High: $40K/quarter Low: $60K/quarter | +$5K / -$15K | Partly (weeks 3 and 7) | Last 12 months of actuals | |
| Fixed costs and taxes: $40K a month, plus $40K estimated tax in week 7 | None (dates and amounts only) | $0 | No swing | Dates and amounts confirmed with your accountant |
As the table shows, assumptions 3 and 4 swing ending cash the most, but both land after week 8. Assumption 1 lands before week 8, and its low end (-$42,000) is bigger than the $32,000 of headroom. That makes "when clients pay" the only assumption that can break the cash floor on its own.
The cash flow forecasting scenarios
Now for the scenario planning. Each scenario in the table below changes something about the plan, usually one or two assumptions, and shows what happens to the low point.
| Scenario | Lowest balance | Against the $160K floor | Ending cash (week 13) |
|---|---|---|---|
| 1. Two hires from week 6 (the preferred plan) | $192K in week 8 | $32K above | $339K |
| 2. Clients pay a week slower (the problem) | $150K in week 8 | $10K below | $297K |
| 3. Hires move to week 10, clients still a week slower (the fix) | $168K in week 8 | $8K above | $315K |
| 4. No hires (for comparison) | $210K in week 8 | $50K above | $375K |
| 5. Project and product both slip (the two biggest swings) | $167K in week 10 | $7K above | $209K |
| 6. Every low end at once (stress test) | $83K in week 12 | $77K below | $113K |
Scenario 2 confirms what the assumptions table showed: clients paying a week slower drops the low point $10,000 below the floor. That's why assumption 1 needs weekly watching and a written action threshold. In this example, the threshold is: if average days to pay runs 3 or more days above 25 for two weeks in a row before week 6, move the hires' first payroll to week 10. Three days is early enough to act, since it holds back $18,000, or about half of your headroom. And two weeks in a row matters because a late week can mean a holiday or a single slow client, while two in a row points to a trend.
Why move to week 10? Because it takes the hires' first two payroll runs ($18,000) out of the weeks leading up to the week 8 low point. That's scenario 3, which keeps the low point at $8,000 above the floor even with clients paying a week slower. After week 8, the product payment arrives, and the balance starts climbing again. The more cautious option is to plan for week 10 from the start, with no threshold to watch. It's the owner's call.
The line graph below follows scenarios 1 to 3 week by week. All three bottom out in week 8, and only scenario 2 (in red) crosses the cash floor.
Make sure your AI cash forecast is safe for your team to act on
AI made the forecast fast. Testing the assumptions is what makes it safe to act on. Before your next big decision, determine:
- The cash reserves you won't go below (your cash floor)
- The low point in your forecast window
- The assumption most likely to push you under that floor
- Your action threshold: the reading that would make you change the plan
Let AI do the number-crunching and the weekly watching, and keep the final decision with you. If the forecast said yes, now you know what that yes depends on.
Fill in the worksheet with your own numbers, then book a demo to see how Alti checks your payment-timing and recurring-revenue assumptions against live account data, and how a weekly Routine Report keeps them in front of you.
Frequently asked questions (FAQs)
What is AI cash flow forecasting?
AI cash flow forecasting is software that uses machine learning to analyze financial data and project a business's cash over the coming weeks, often a 13-week window. It learns from transaction history and reruns scenarios in seconds. But its forecast is only as reliable as its assumptions.
How accurate is AI cash flow forecasting?
Forecast accuracy depends on how much data you have, data quality issues like miscategorized transactions, and how stable the business is. Published accuracy figures describe past averages, not the one week a decision depends on. Start by asking how the tool's last forecast compared with what happened, and check the low point, the lowest balance in the forecast window.
Which assumptions matter most in a cash flow forecast?
For businesses with recurring clients, the assumption most likely to push your lowest balance below the minimum you'll accept is how quickly clients pay. This is measured as days sales outstanding (DSO). Each extra day clients take to pay, on average, holds back about a day of billing.
Can AI predict when clients will pay?
Predictive models can estimate payment timing from each client's history and flag changing patterns. However, they can't see what isn't in your financial data, such as a dispute or a renewal conversation. Treat any expected payment date as a range from your own history.
How does Alti help with cash flow forecasting?
Alti, the financial intelligence inside Alternative Payments, helps you test the assumptions in a cash forecast that depend on client payments, such as payment timing and recurring revenue. Ask Alti which clients' on-time payment rates have slipped, and it answers from live account data. You can also save the question as a weekly Routine Report. Alti doesn't build the forecast itself, so you can keep it in whichever spreadsheet or planning tool you already use.
What is a 13-week cash flow forecast?
A 13-week cash flow forecast is a standard liquidity management tool for finance teams. It projects a business's cash balance week by week for the next quarter, listing expected cash inflows, such as client payments, and cash outflows, such as payroll and taxes, on the weeks they actually hit the bank. Thirteen weeks is long enough to see a cash squeeze coming, but short enough to stay accurate.
How often should you update a cash flow forecast?
Update a short-term cash flow forecast at least weekly, especially in the weeks before its lowest balance. Compare what actually came in and went out with what you assumed, and adjust any assumption that keeps landing outside its expected range. AI forecasting tools can update the forecast for you as real-time data comes in.
Simplify your customer payments, unlock instant cash flow
Keep reading


AI cash-flow forecasting: how business owners can test assumptions

Can AI financial analysis explain why your margins changed?