•
IT Services
March 24, 2026
Build Predictable EBITDA Growth with KPI Dashboards for MSPs
The firms growing fastest today connect KPI dashboards, utilization rate, and capacity planning into one system — and that system is where FinTech Advisory becomes a practical advantage. This integrated approach supports stronger firm valuation, steadier cash flow, and consistent EBITDA growth.
Predictable growth comes from clear numbers that guide daily decisions.
What Drives Predictable Growth in MSPs
Predictable growth starts when data stays close to the work.
High-performing MSPs track utilization rate, revenue, and cash flow as activity happens. KPI dashboards bring those signals together in real time, which allows leaders to act while there is still room to adjust.
You can shift resources before utilization rate drops too far. You can refine pricing while margins remain strong. You can improve delivery without waiting for month-end reports.
That is how data-driven decision making turns into real operational control.
What Should KPI Dashboards Include
KPI dashboards work best when they stay focused on a small set of connected metrics.
Utilization rate shows how effectively your team converts time into revenue. Revenue and margin by client show where profit actually comes from. Cash flow shows when that revenue turns into usable capital.
When these metrics sit together, cause and effect becomes easier to see.
A dip in margin often traces back to a change in utilization rate. Strong revenue with slow cash flow points to billing or payment timing. Clear dashboards allow you to connect these signals without guessing.
This is where KPI dashboards move from reporting into decision-making tools.
How Utilization Rate Impacts EBITDA Growth
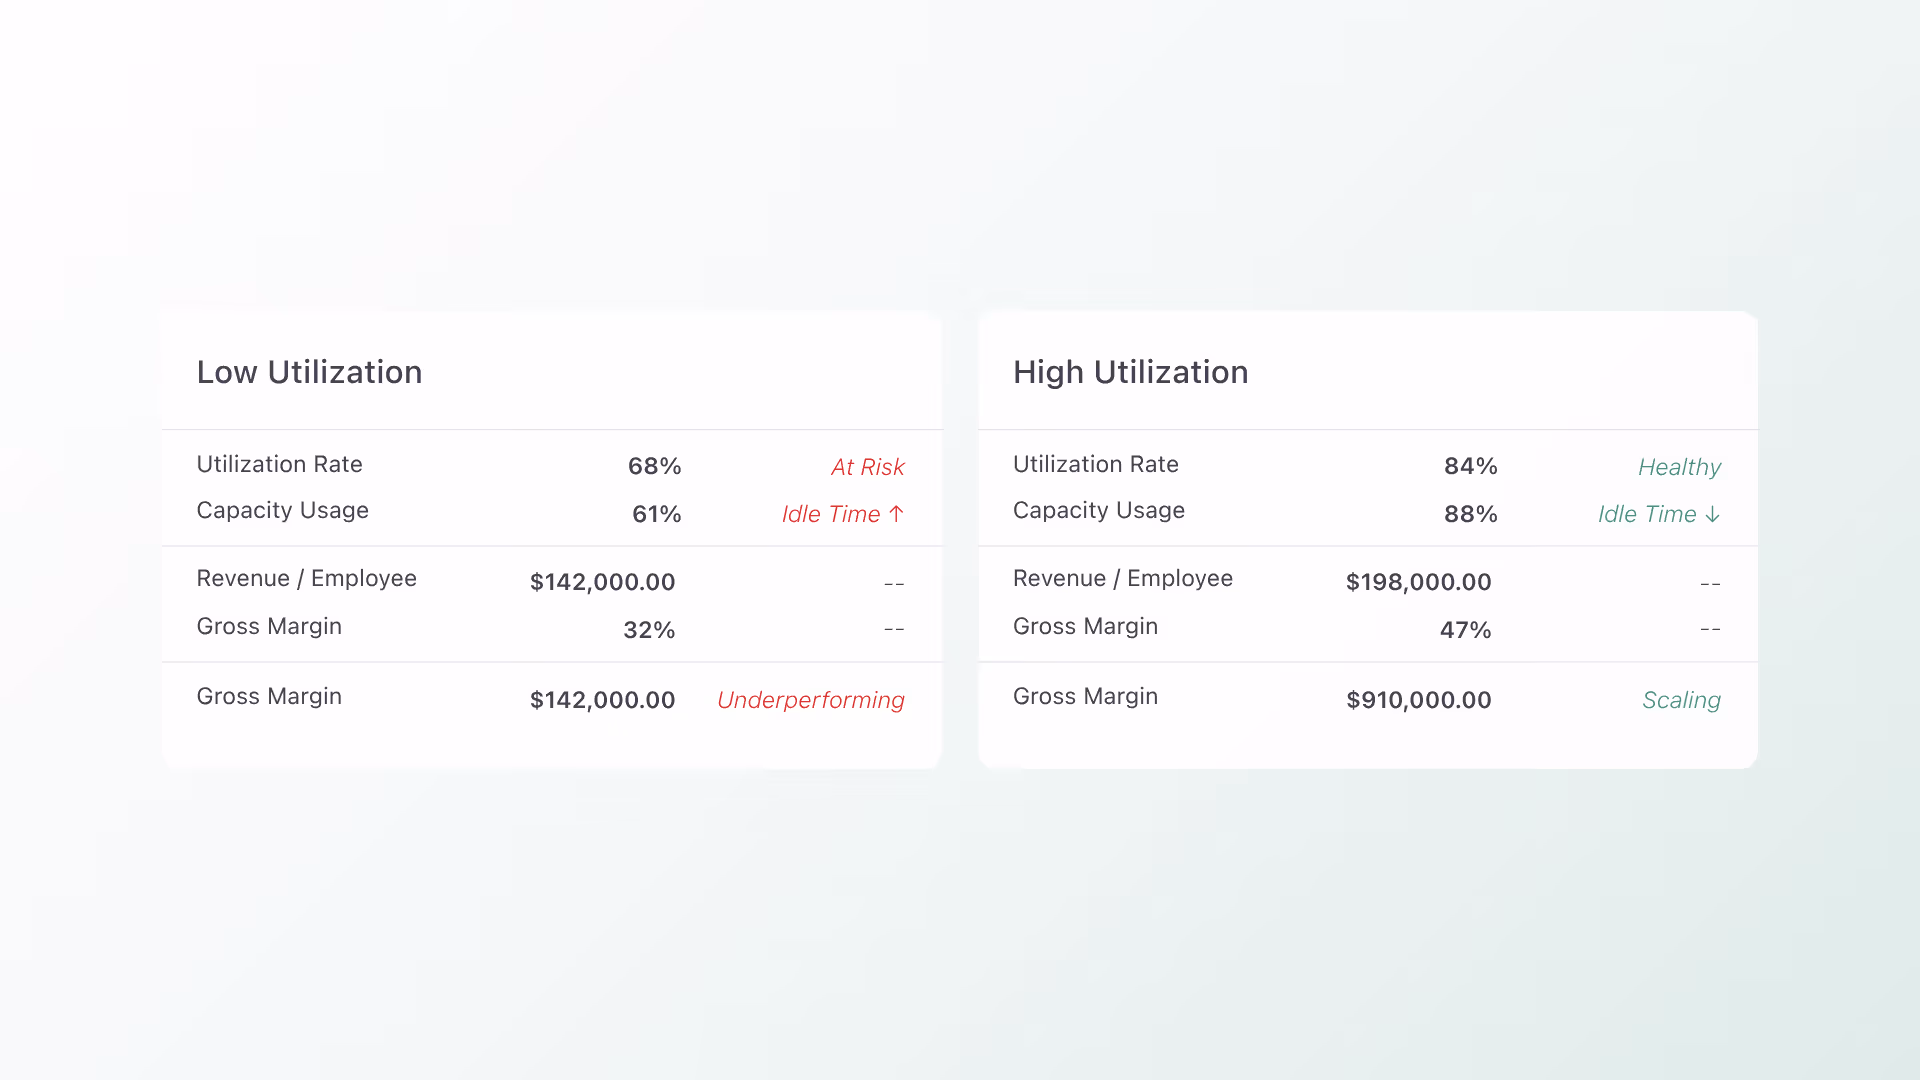
Utilization rate directly influences EBITDA growth.
When more of your team’s time is billable, revenue increases while fixed costs stay stable. That additional revenue flows into EBITDA with very little friction.
Even small improvements can have a meaningful effect over time:
- A modest increase in utilization rate across a delivery team often leads to higher annual profit without adding headcount.
- The impact compounds as the business grows, turning incremental efficiency gains into sustained EBITDA improvement.
- This only works when utilization rate stays visible and is managed consistently — which is exactly what KPI dashboards provide.
Capacity Planning as a Driver of Predictability
Capacity planning brings structure to growth.
It aligns your team with expected demand and helps you balance workload across clients. This balance supports a steady utilization rate while maintaining service quality.
With clear capacity planning, hiring decisions become more grounded. You can see when demand supports expansion and when your current team can take on more work.
When capacity planning connects with KPI dashboards, growth feels more stable. You spend less time reacting and more time guiding how work flows through the business.
How KPI Dashboards Influence Firm Valuation
Firm valuation reflects consistency.
Buyers look for businesses that generate predictable revenue, maintain stable margins, and collect cash on time. KPI dashboards help demonstrate all three.
They show how utilization rate performs over time. They highlight how capacity planning supports delivery. They reveal how cash flow moves from invoice to payment.
This level of clarity builds confidence. It makes performance easier to validate and supports stronger firm valuation.
Where FinTech Advisory Fits in the Model
FinTech Advisory connects the systems behind your numbers.
It aligns billing, payments, and accounting so data flows cleanly from service delivery into financial reporting. This alignment ensures KPI dashboards reflect current performance rather than delayed updates.
When your systems work together, your data becomes more reliable.
That reliability supports better decisions across pricing, hiring, and client mix. It also strengthens the foundation for consistent EBITDA growth.
How Alternative Payments Improves KPI Accuracy and Cash Flow
Accurate KPI dashboards depend on clean and timely financial data.
When invoices go out late or payments take too long to arrive, dashboards lose their accuracy. That delay makes it harder to act on what you see.
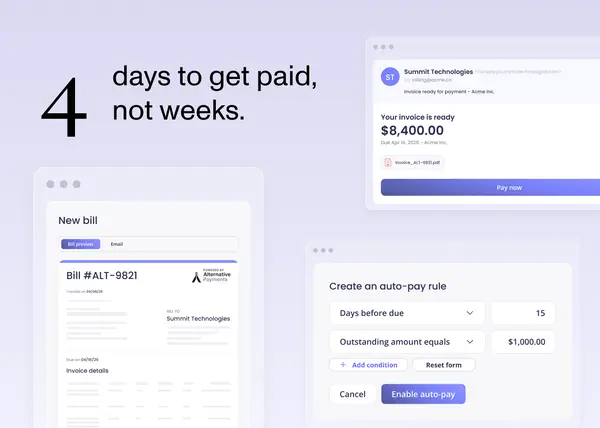
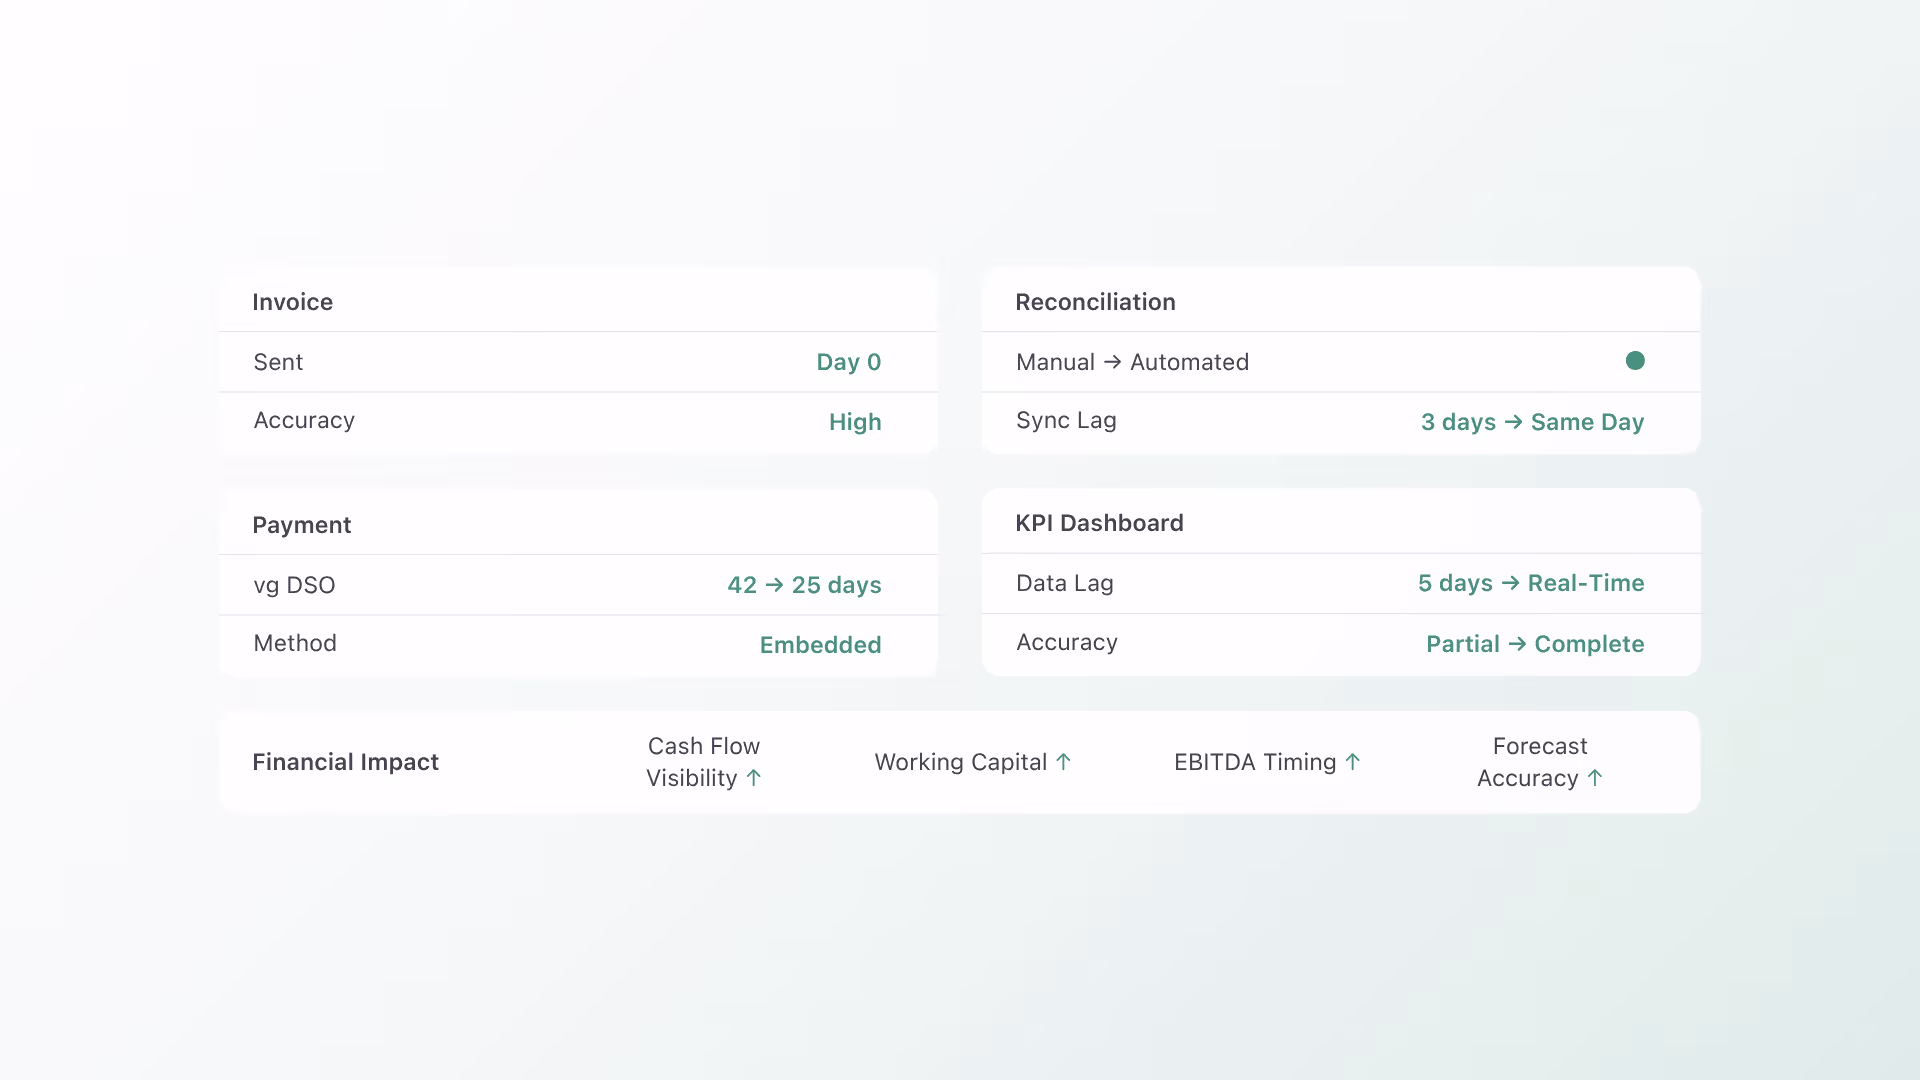
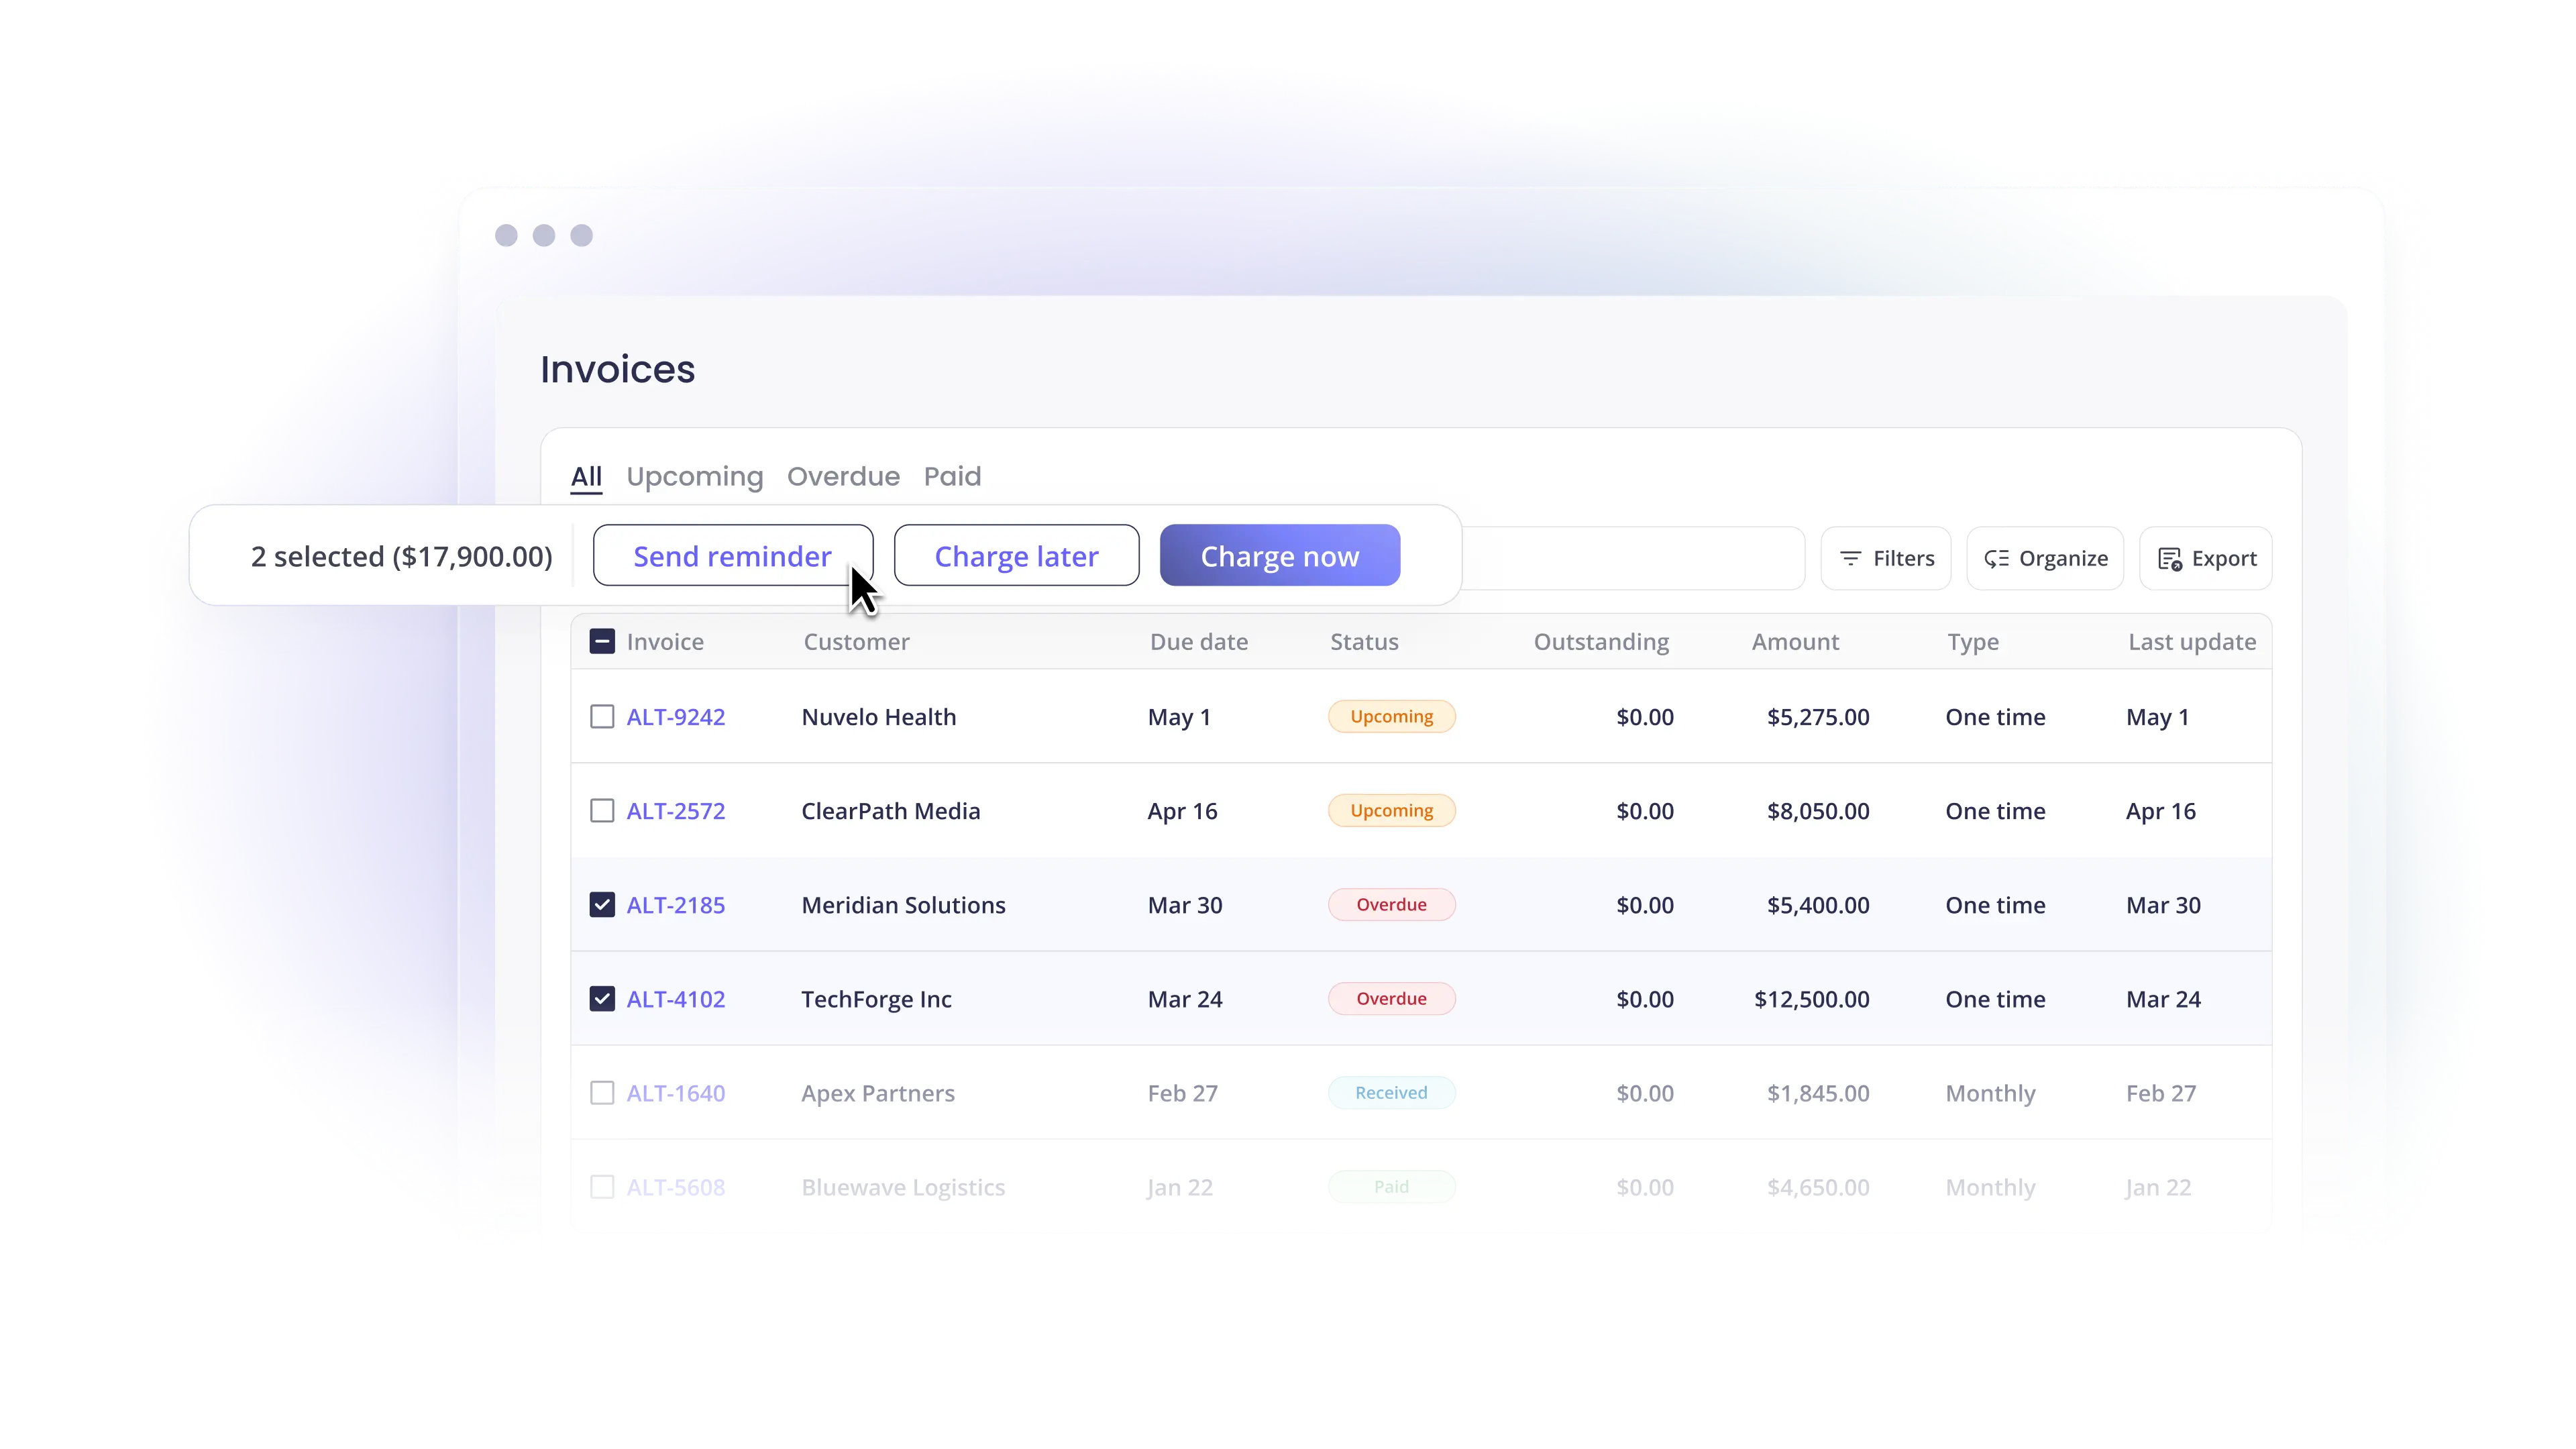
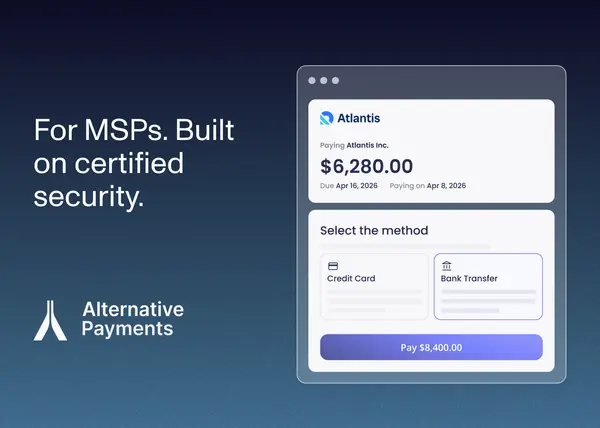
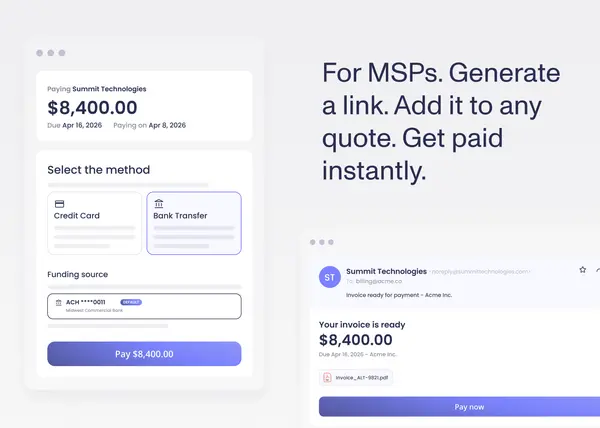
Alternative Payments improves this by connecting invoice delivery, payment collection, and reconciliation into one continuous process.
Invoices go out on time. Clients pay through embedded payment options. Payments sync back into your accounting system without manual work.
This creates a direct impact on your core metrics:
- KPI dashboards reflect current financial data.
- Utilization rate aligns more closely with revenue timing.
- Capacity planning becomes more precise because cash flow is visible.
- EBITDA growth improves as cash arrives faster.
Clients also benefit from a smoother payment experience, which supports faster collections without adding pressure to your team.
How to Build a Predictable Growth Model
Predictable growth comes from consistent execution across a few key areas.
Firms that achieve this keep KPI dashboards close to daily operations. They manage utilization rate with intention and align capacity planning with real demand. They also maintain financial systems that keep data accurate and current.
These habits build momentum over time.
Decisions happen earlier. Margins remain steady. EBITDA growth becomes more consistent and easier to scale.
A Practical Next Step for MSP Leaders
If you are already tracking KPI dashboards, utilization rate, and capacity planning, the next step is improving how financial data moves through billing and payments.
This is often where delays begin and where visibility weakens.
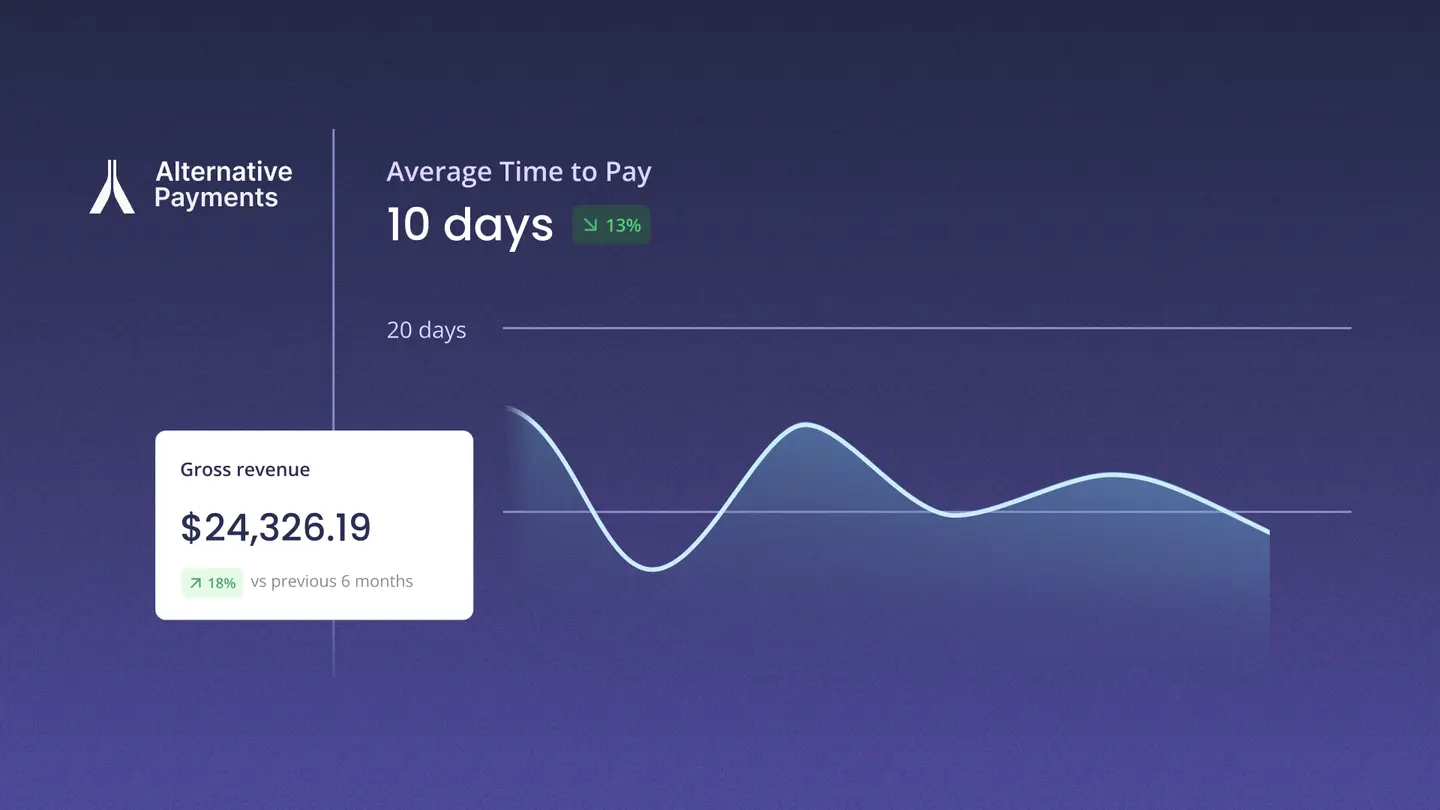
Book a 20-minute demo and see how Alternative Payments cuts your DSO by 40%.
Simplify your customer payments, unlock instant cash flow
Keep reading

Introducing Custom Payment Links: A Faster Way to Get Paid